
Last time, I showed you how to model a multi-sided business using a Lean Canvas.
In this post, I will show you how to get more specific and test the viability of these types of business models.
I’ll extend the simple back-of-the-envelope technique for ballparking direct business models I described in this post to ballparking multi-sided business models.
1. Determine your Minimum Success Criteria
Your minimum success criteria is the smallest outcome that would deem the project a success for you X years from now.
As I’ve described before, the minimum success criteria goal is a function of personal ambition and other analogs that support that ambition.
When Facebook launched, social networking had already made a great splash and, even back then, was commanding incredible valuations.
- Friendster launched in 2002 and grew to 3 million users in two months. By the end of the first year, it was valued at $53m (based on the investment round).
- Myspace launched in 2003 and grew to 5 million users within a year. By the end of the first year, it was valued at $46m (also based on an investment round).
Given these numbers and the environment at the time, it would have been “reasonable” to state the minimum success criteria as a $100m valuation in 2 years.
Notes:
- I am using a $100m valuation because it's a nice round number and also because it's the typical investor exit milestone.
- We know that at the end of year 1, Myspace tried to acquire Facebook but got turned down by Mark Zuckerberg’s asking price of $75m (source). So at least then, we know that Zuckerburg’s minimum success criteria were at least $75m.
Ok, that was simple enough. Now comes the more interesting part.
How do we get there?
2. Convert your Minimum Success Criteria to a Customer/User Throughput Number
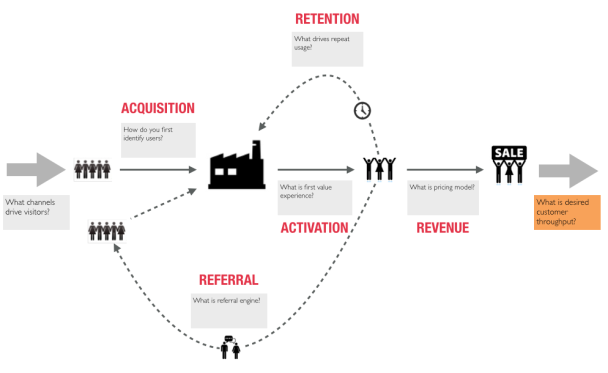
We need to convert our minimum success criteria goal into a more actionable number. I prefer using customer throughput from the “Customer Factory” metaphor.
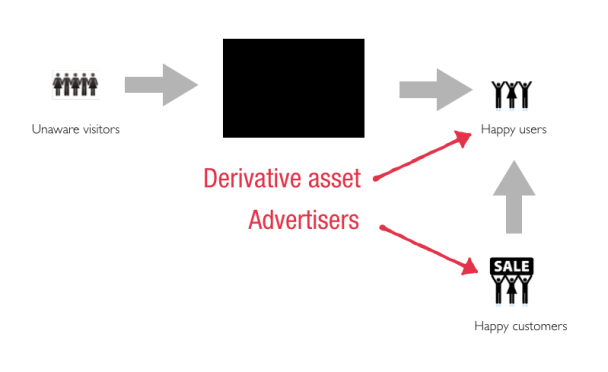
The universal goal of every business is to make happy customers.
Happy customers get you paid, and doing this repeatedly and sustainably is the goal of every business.
In this case, though, you need first to create happy users and then find customers who will pay for their happiness.

I’ll show you two ways to ballpark your user throughput against your minimum success criteria:
a. Model against your closest analogs
For Facebook to command a higher valuation than its competitors, it would need to outperform them. So it helps to start by benchmarking against their actual numbers.
Friendster registered its three millionth user within the first few months (source), while Myspace registered it’s five millionth user within the first year (source).
Despite these impressive starting numbers, both these services had begun experiencing declining user retention and engagement.
One of the key insights that led to Facebook’s success was that they were trying to remove friction from a pre-existing social network rather than creating a new one (like their competitors).
Instead of doing a public launch, they employed a staged rollout strategy which allowed them to narrow down on their customer segment, not be distracted by scaling concerns (which had been a big problem for Friendster), and instead really focus on first getting their repeatable “Customer Factory” right.
Facebook won on strategy, not vision.
Establishing repeatability is a pre-requisite to pursuing growth.
Facebook recorded its millionth user at the end of the first year and it’s five millionth user at the end of year 2. While a slower initial user adoption rate, Facebook demonstrated much higher (2X) user retention and engagement rates which translated to much better ROI for their customers (advertisers).
While benchmarking against your analogs’ user throughput is a reasonable way to start, it leaves lots of risky assumptions (or leaps of faith) still on the table.
Leap of Faith #1: Valuations stay consistent
As with any derivative asset, the only thing constant is that valuations will fluctuate wildly as a function of time and the investing environment.
Here the derivative asset is the number of active users. Before 2002, getting to 1 million active users within a year was a big deal. The power laws of networks as platforms have raised the bar for what is now considered “impressive traction.”
Facebook’s $1 billion acquisition of Instagram and $19 billion acquisition of WhatsApp show both the speed and volatility of these changes in user growth and valuation.
Leap of Faith #2: Someone (the customer) will pay for these users
In the interest of getting in the game early, investors and acquirers also have to make their valuations early — sometimes even before there is a demonstration of how the derivative asset will be converted to money. This can often lead to situations where just having impressive user growth may not be enough. You need to have phenomenal user growth and engagement. Both Twitter and Snapchat are examples of these.
In the case of an acquisition, you only need one buyer to take that leap of faith with you. With investors and/or an IPO, you need to convince others that you will find a way to extract gold from your users. Skype’s billion-plus acquisition by eBay and subsequent sale at a loss show the potential for downward mobility of these valuations.
For these reasons, while it's helpful to benchmark against current analogs for customer throughput (or traction rates), I recommend checking these numbers against your business model economics assumptions, which we’ll do next.
If your competition is as clueless as you are, simply trying to anchor and position against them can be fatal.
b. Calculate your derivative currency exchange rate
Last time we calculated the derivative currency exchange rate, so that I won’t repeat that here.
The derivative currency exchange rate is the current market rate for your user asset.
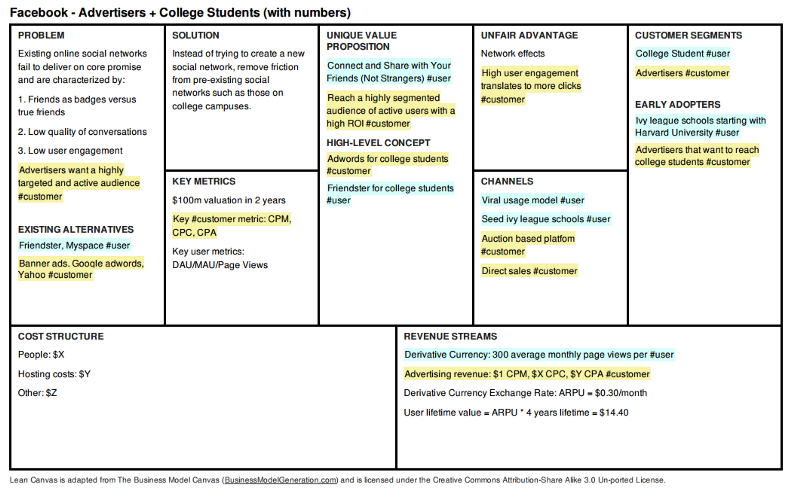
Here was the completed canvas with specific pricing numbers:
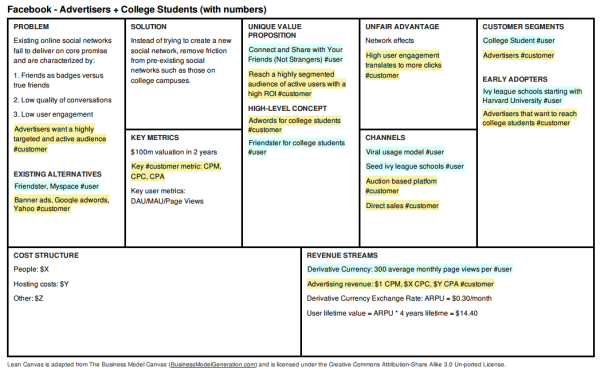
Now that we have specific pricing in our model, we can use this to estimate how many active users we will need. To do this, though, we need to first reduce the $100M valuation into a more tangible revenue number.
A commonly used approach for such valuations is using a revenue multiple. The challenge with revenue multiples is that they, too, can vary widely across both time and company stage/growth. You can still get a decent range by studying the valuations of other close analogs (or peers) at the present moment. In 2014, for instance, this multiple ranged from 5x (for Google) to 20x (for Twitter) — source.
A reasonable number to use here might be 10x (which coincidentally also happens to be Facebook’s current revenue multiple).
So to command a $100M valuation, we’d need to generate $10M/yr in revenue.
Doing the math with $1 CPM results in 10 billion impressions per year or 800 million impressions per month, or 27 million impressions per day.
We’re almost there…
To get to the number of active users, we need one more assumption in the model: the average number of monthly page views per user. In 2010, Facebook’s closest rival, Hi5, had an average of 351.2 monthly page views per user. MySpace came in at 261.8 monthly page views per user (source). Facebook again outperformed both of these with 661.8 monthly page views per user.
Again let's assume there was no way for Facebook to predict this and assume a much lower 300 monthly page views per user. Then to generate $10M/yr in revenue, Facebook would need 800 million impressions per month or 2.67 million monthly active users by the end of year 2.
3. Test/Refine Your Business Model Against Your Minimum Success Criteria
Now that we have a ballpark target customer throughput rate and a set of input assumptions on how we got there, we can start testing this model bottoms-up.
A business model can be validated at micro-scale.
In Facebook’s case, they did precisely that. Instead of a public launch, they demonstrated impressive customer factory metrics at a smaller scale where they could go into any college campus and, in 30 days, get over 70% of the student population logging into Facebook daily.
They had a million active users by the end of year 1 and 5 million active users by the end of year 2 — outperforming this model. But more than the active user assumptions, it was their more than impressive engagement metrics that became leading indicators of much higher future revenue, which allowed them to command even higher valuations than any of their competitors.
I frequently argue that this staged rollout strategy greatly contributed to Facebook’s success. Even when they considered expanding beyond college students, Facebook first modeled their new audience at a smaller scale using private company launches, and only when they got the mechanics right, did they open up Facebook to everyone.
The rest, as they say, is history…
Disclaimer:
My goal with this post wasn’t to rationalize history in retrospect but rather to demonstrate how we can build models even in fast-moving environments (like Facebook’s) and test the input assumptions into those models, first at a small scale and then permit ourselves to scale them all the way.
Like scientists, our job as entrepreneurs is first to build a model and then test that model through small and fast, carefully crafted experiments.